Slippage-at-Risk Across Exchanges and Market Regimes
A multi-exchange empirical study of liquidity risk in cryptocurrency perpetual futures markets, extending the SaR framework with cross-venue comparison and stress-period analysis using high-frequency order book data.
Contents
Abstract
We extend the Slippage-at-Risk (SaR) framework of arXiv:2603.09164 from a single-exchange, single-period setting to a comprehensive cross-exchange, cross-regime empirical study. Using Kaiko Level-10 order book snapshots from 5 major cryptocurrency derivatives exchanges (Binance Futures, OKX, FTX, Bybit, Huobi) across 8 distinct market periods — including four major stress events (COVID crash, China mining ban, Terra/LUNA collapse, FTX bankruptcy) — we analyze over 2,600 token-period combinations spanning March 2020 to April 2023.
We find three principal results. First, exchange selection dominates market regime as a determinant of slippage risk: Binance Futures maintains SaR(95%) of 37–66 bps for $100K trades across all periods, while OKX ranges from 240–430 bps — a persistent 6–8× gap that dwarfs stress-induced variation within any single exchange. Second, the SaR framework exhibits early-warning properties for exchange failures: FTX's insurance fund requirement peaked during the bull market ($26K) months before its collapse, driven by extreme liquidity concentration. Third, concentration haircuts amplify SaR estimates by 35–90% across exchanges, with the magnitude inversely correlated to market depth, suggesting that DEX-native exchanges with on-chain transparency may offer structural advantages for risk monitoring.
Key Results at a Glance
SaR(95%) for $100K market sell orders across exchanges and market regimes (in basis points).
| Exchange | COVID Crash 2020-03 |
China Ban 2021-05 |
Bull Peak 2021-11 |
Terra/LUNA 2022-05 |
Range 2022-09 |
FTX Collapse 2022-11 |
Recovery 2023-01 |
Normal 2023-04 |
|---|---|---|---|---|---|---|---|---|
| Binance | — | 65.6 | 27.4 | 58.6 | 50.4 | 65.2 | 39.8 | 37.5 |
| OKX | 240.6 | 325.8 | 384.0 | 346.0 | 430.7 | 312.5 | 426.9 | 299.3 |
| FTX | 290.8 | 525.0 | 798.7 | 671.0 | 499.3 | 586.5 | — | — |
| Bybit | — | 44.1 | 38.6 | — | — | — | — | — |
| Huobi | — | 129.0 | 119.6 | — | — | — | — | — |
🟢 Binance: Consistently Superior Liquidity
SaR(95%) for $100K trades never exceeds 66 bps across all observed periods, including four major market crises. This stability suggests deep, diversified market-making infrastructure.
🔴 FTX: Hidden Fragility in Bull Markets
FTX's SaR peaked at 799 bps during the Nov 2021 bull market — the worst reading of any exchange in any period. High volume masked extreme concentration risk that presaged the exchange's collapse.
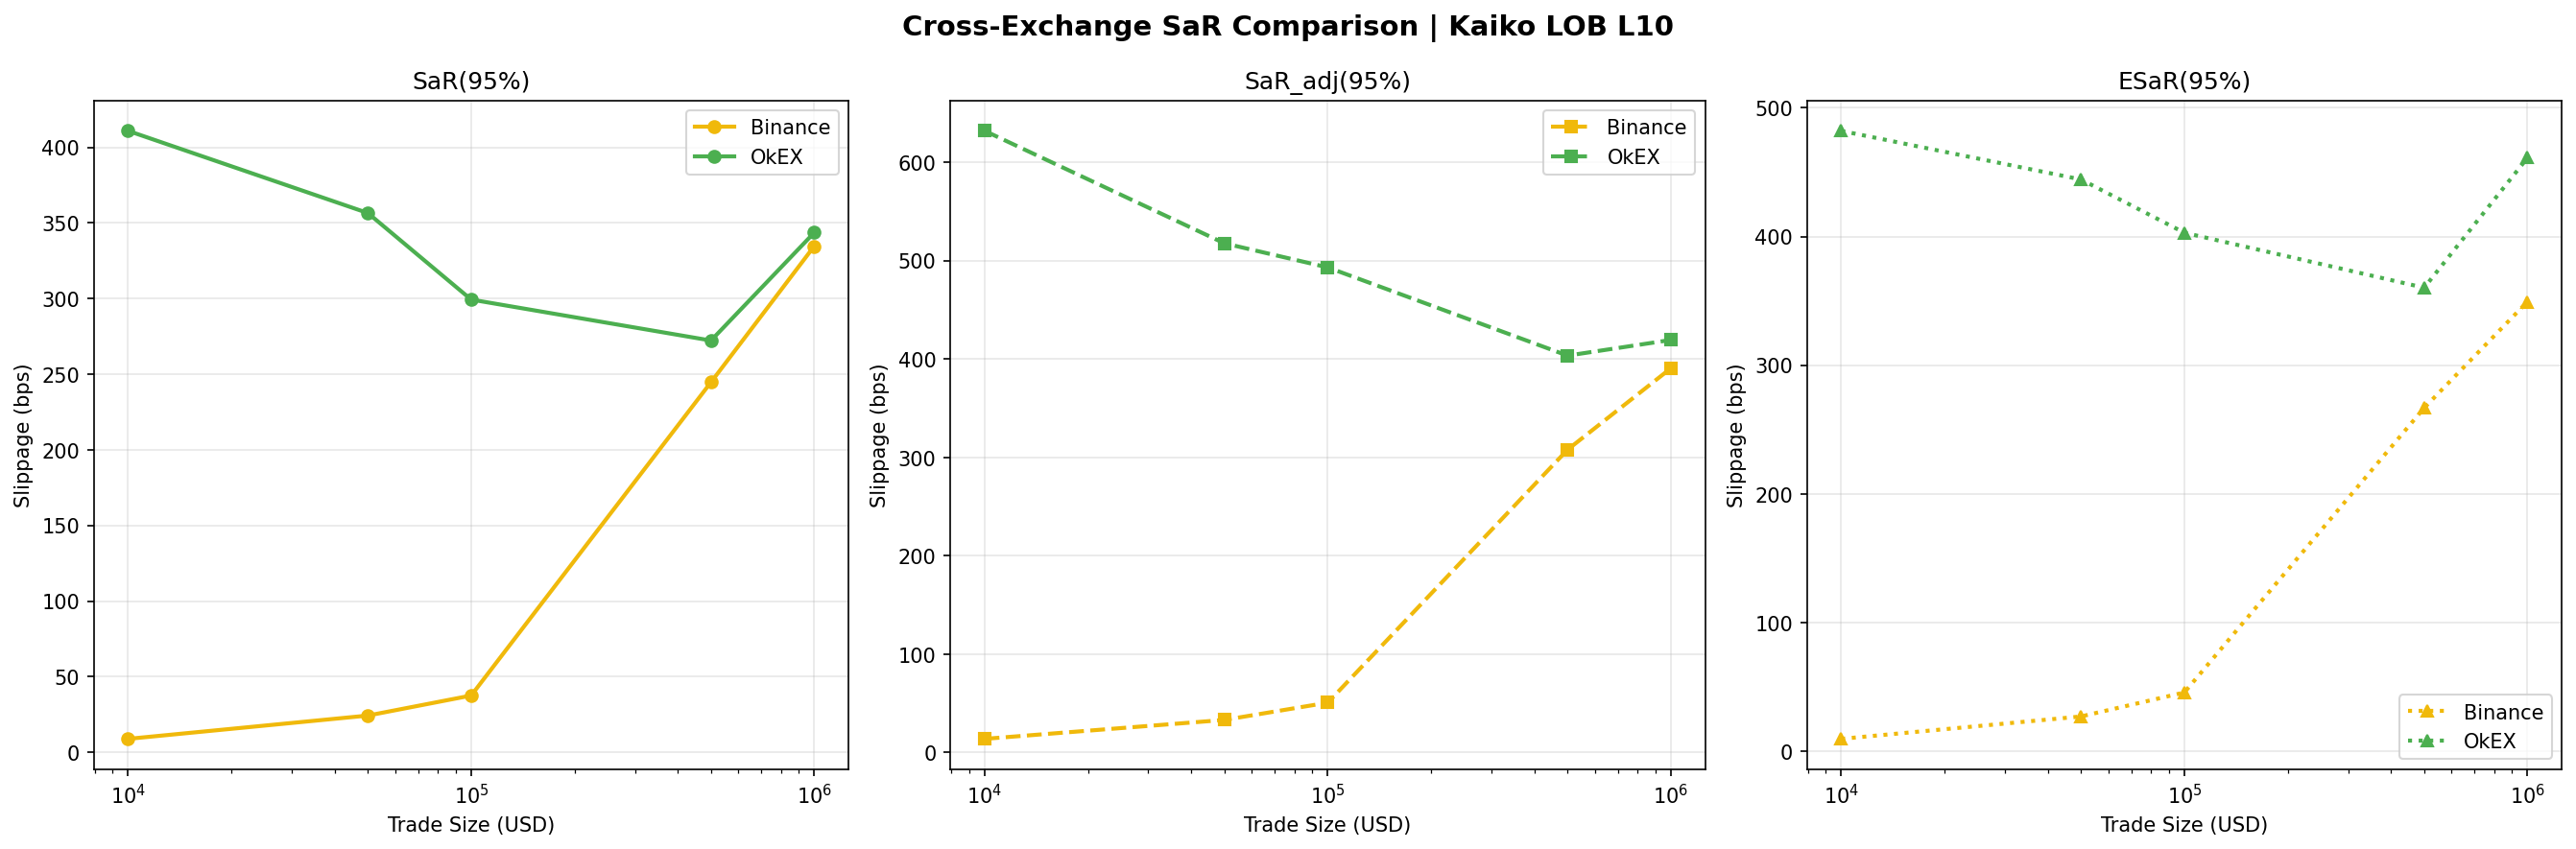
SaR Across Market Regimes
How does slippage risk evolve across bull markets, bear markets, and crisis events? We track SaR(95%) and SaR_adj(95%) for four trade sizes across all exchanges and periods.
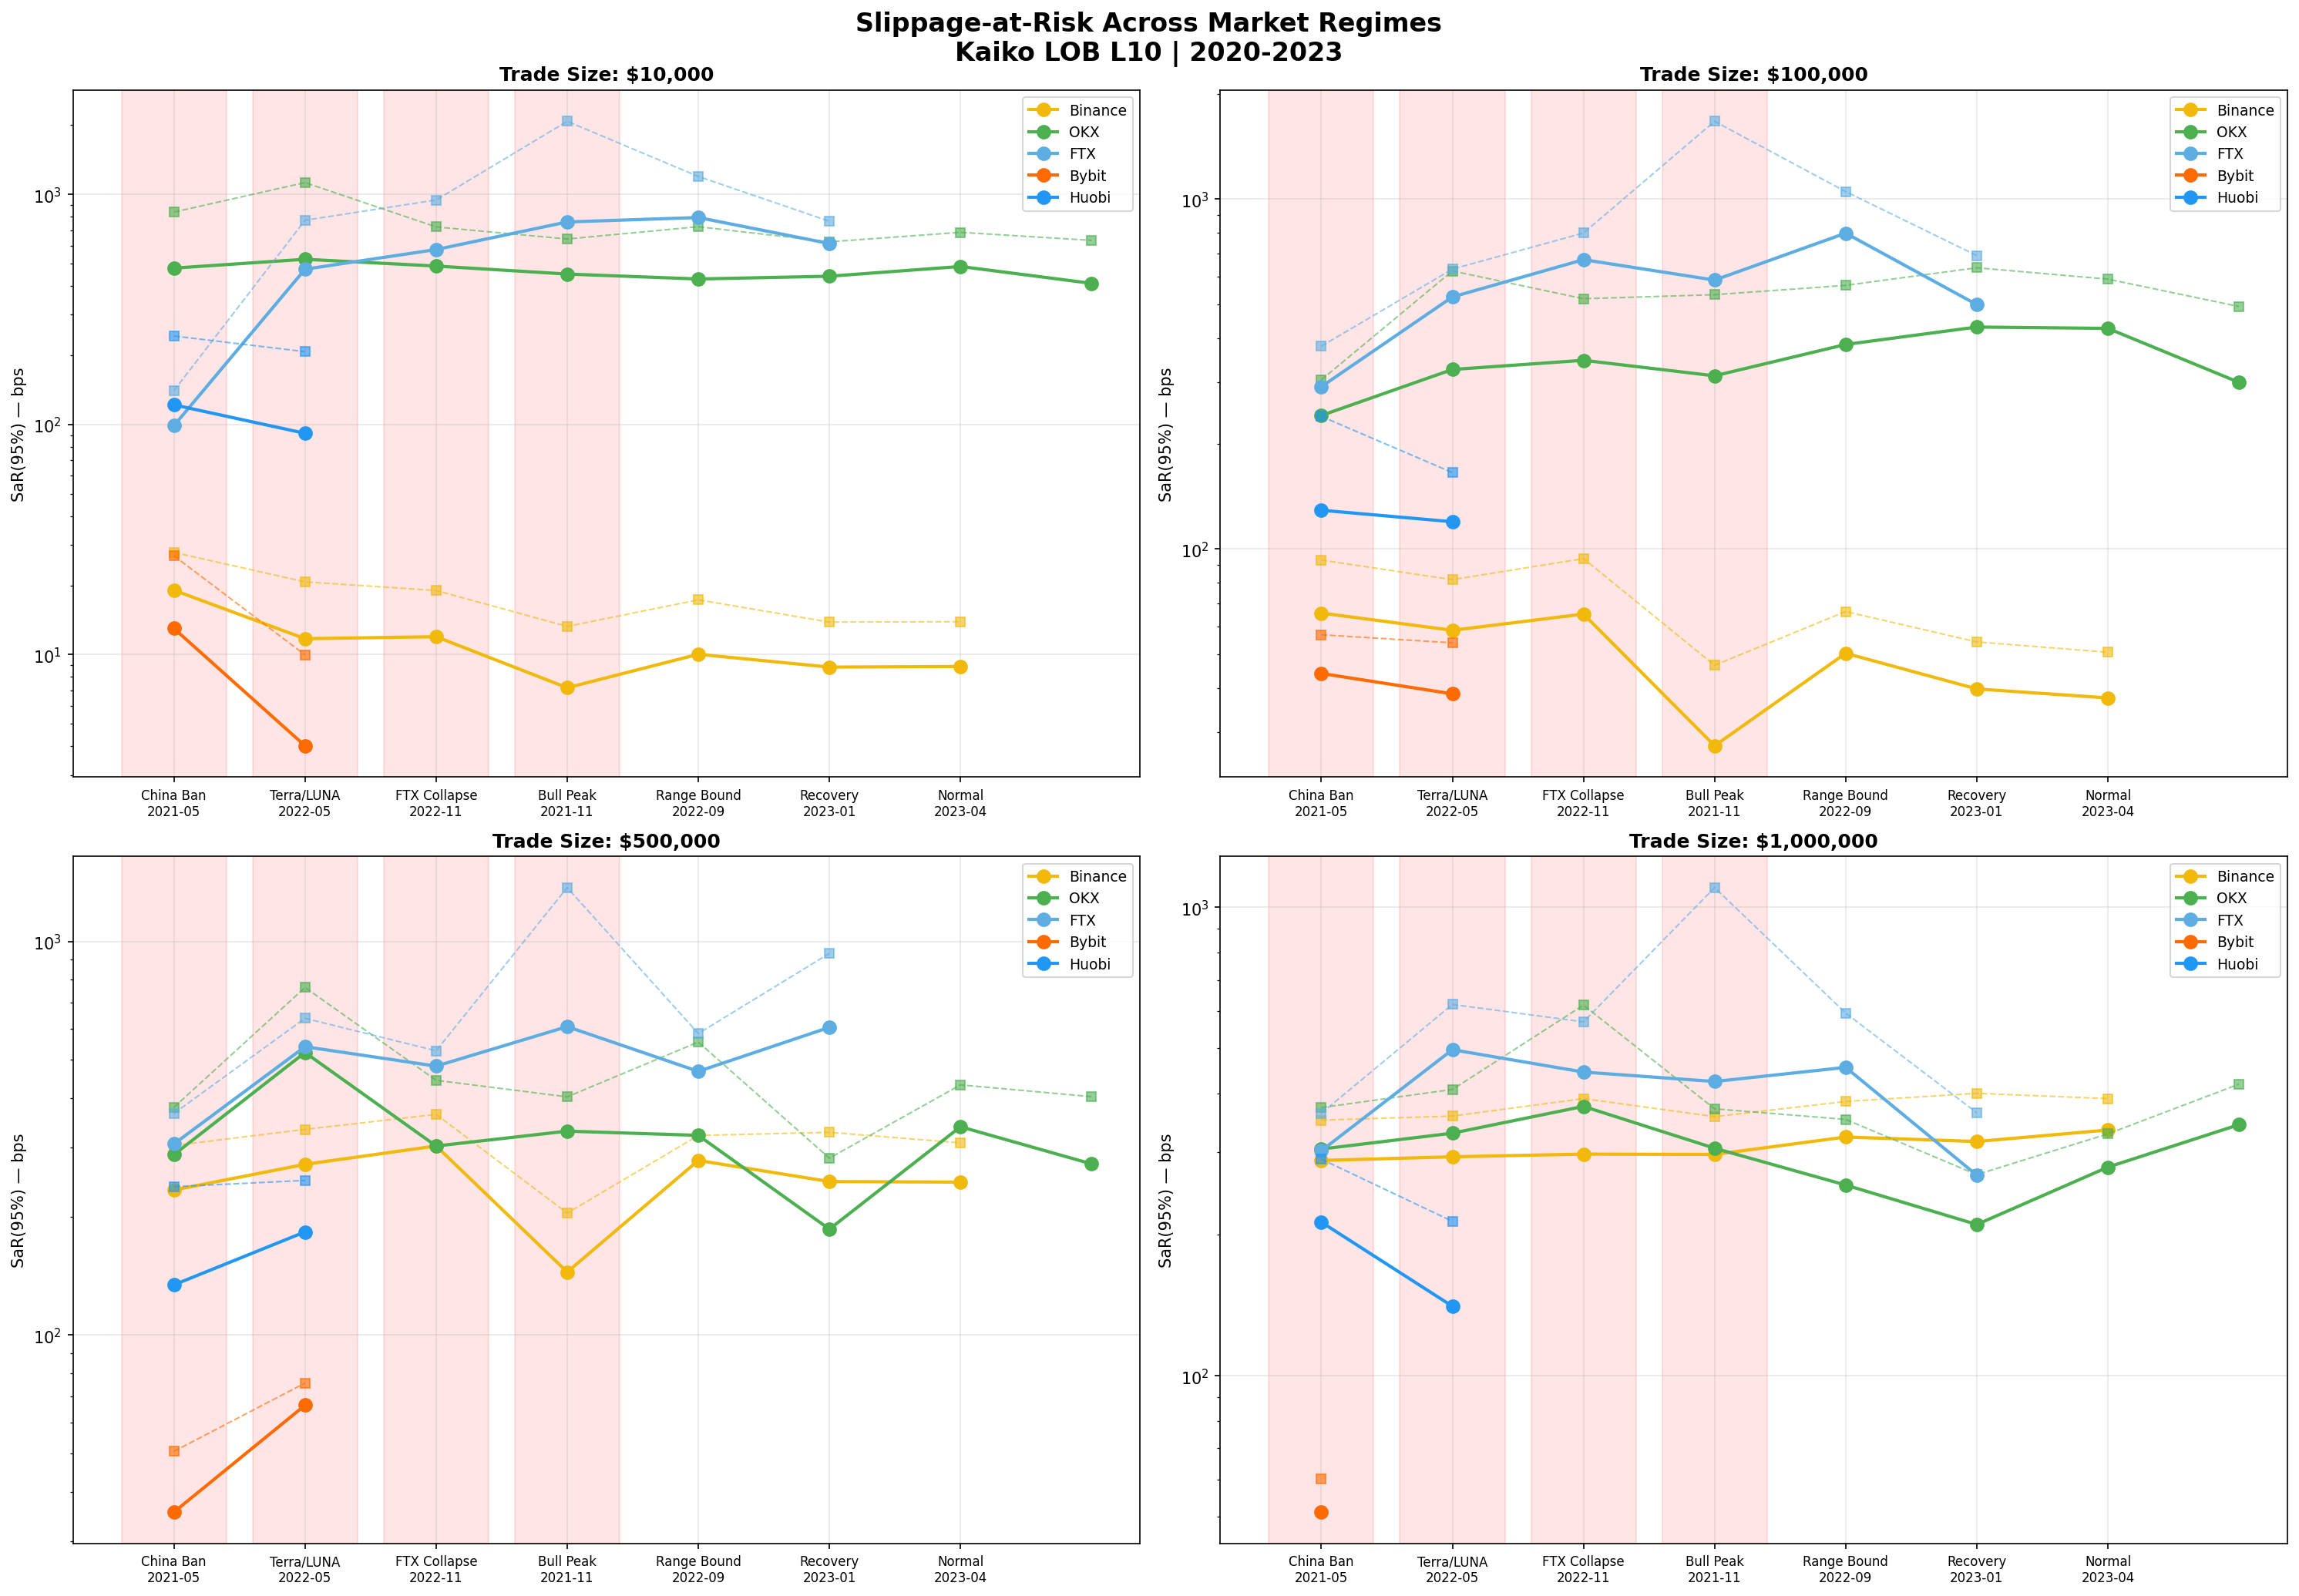
Exchange Selection > Market Timing
The cross-exchange SaR gap (6–8×) is substantially larger than the within-exchange stress/normal variation (1.5–2×). This implies that for risk management purposes, which exchange you trade on matters more than when you trade.
Stress Amplification
We compute the ratio of stress-period SaR to normal-period SaR for each exchange, quantifying how much worse slippage becomes during crises.
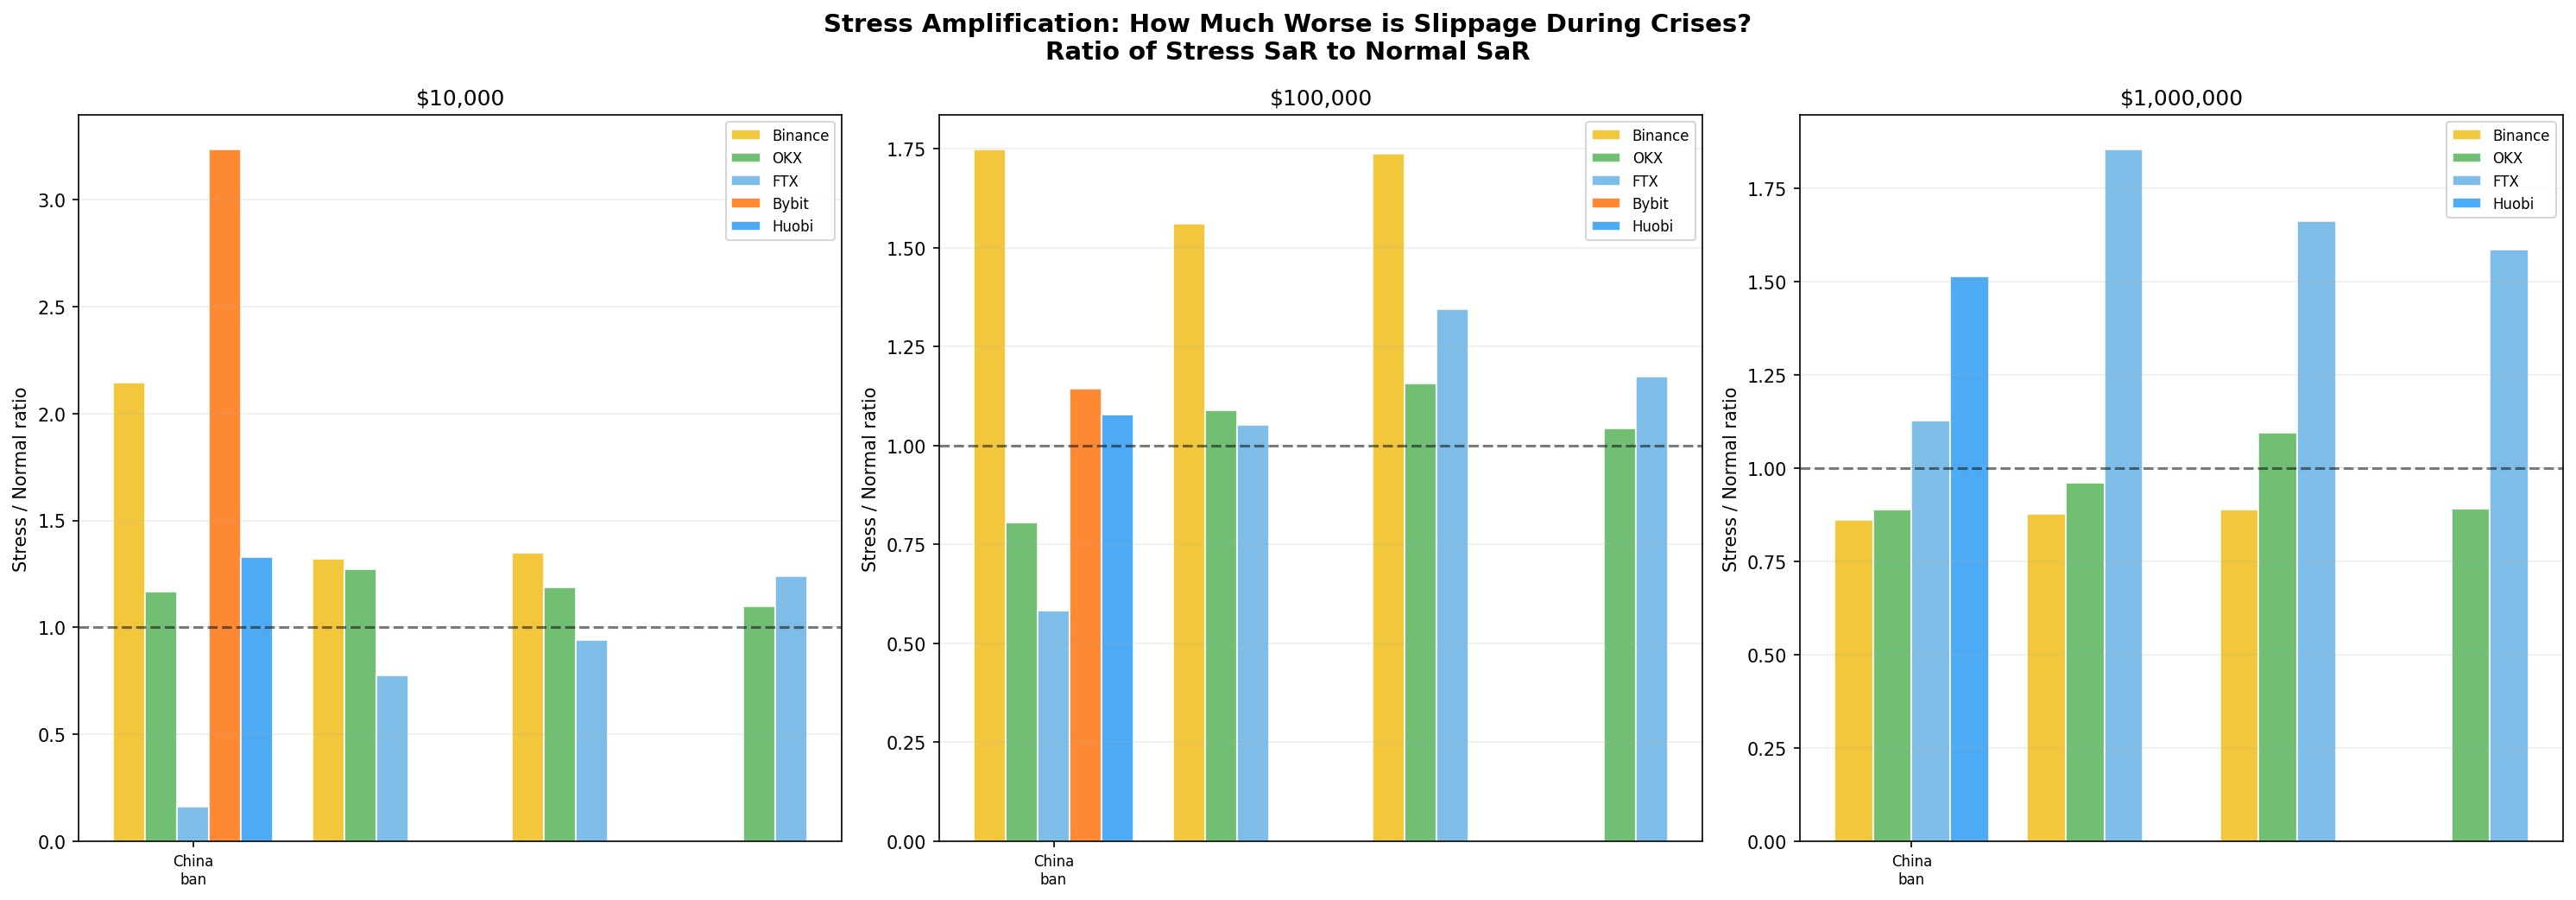
⚠️ Large Orders Are Most Vulnerable
$1M trade SaR amplifies by 1.5–3× during stress vs ~1.2× for $10K trades. This nonlinearity implies that insurance funds calibrated to small-trade stress tests will systematically underestimate tail risk from large liquidations.
🔴 FTX Self-Amplification
During its own collapse (Nov 2022), FTX's concentration-adjusted SaR spiked by 184% — the most extreme amplification in our dataset. This self-referential feedback loop (withdrawal → depth reduction → higher SaR → more withdrawal) is the signature of an exchange death spiral.
Exchange Liquidity Landscape
Four-dimensional view of exchange microstructure: spread, depth, slippage, and concentration.
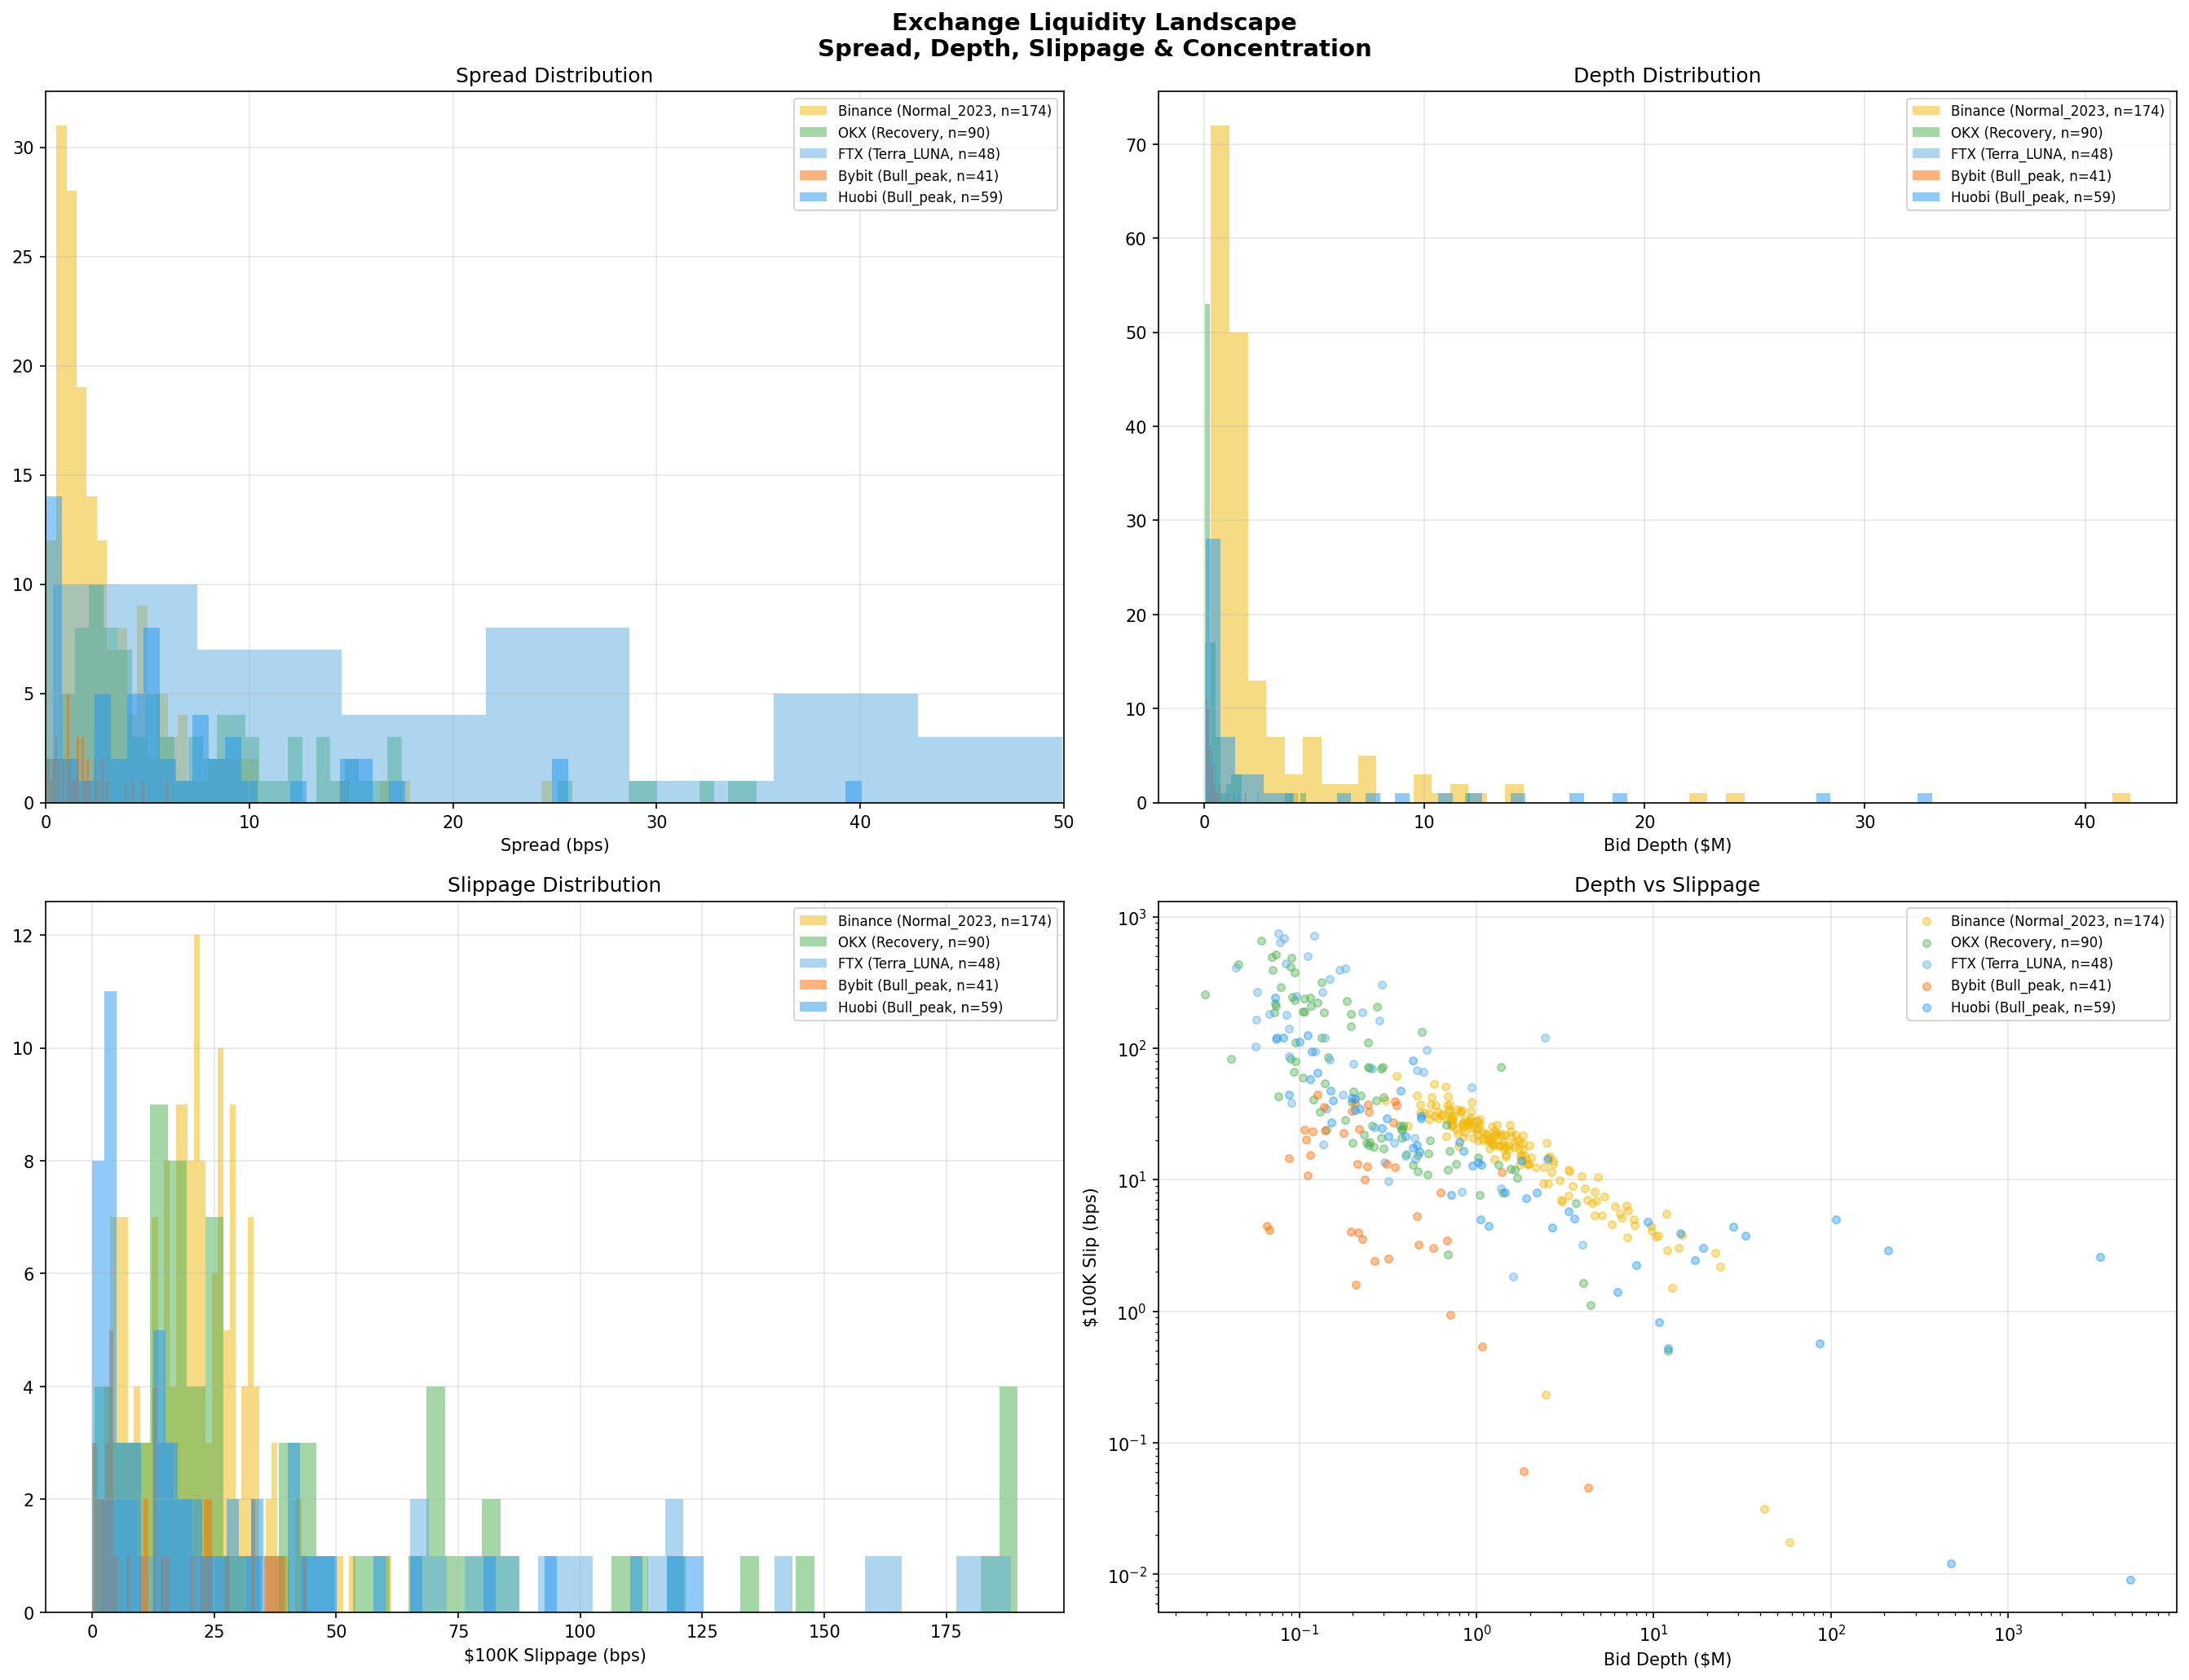
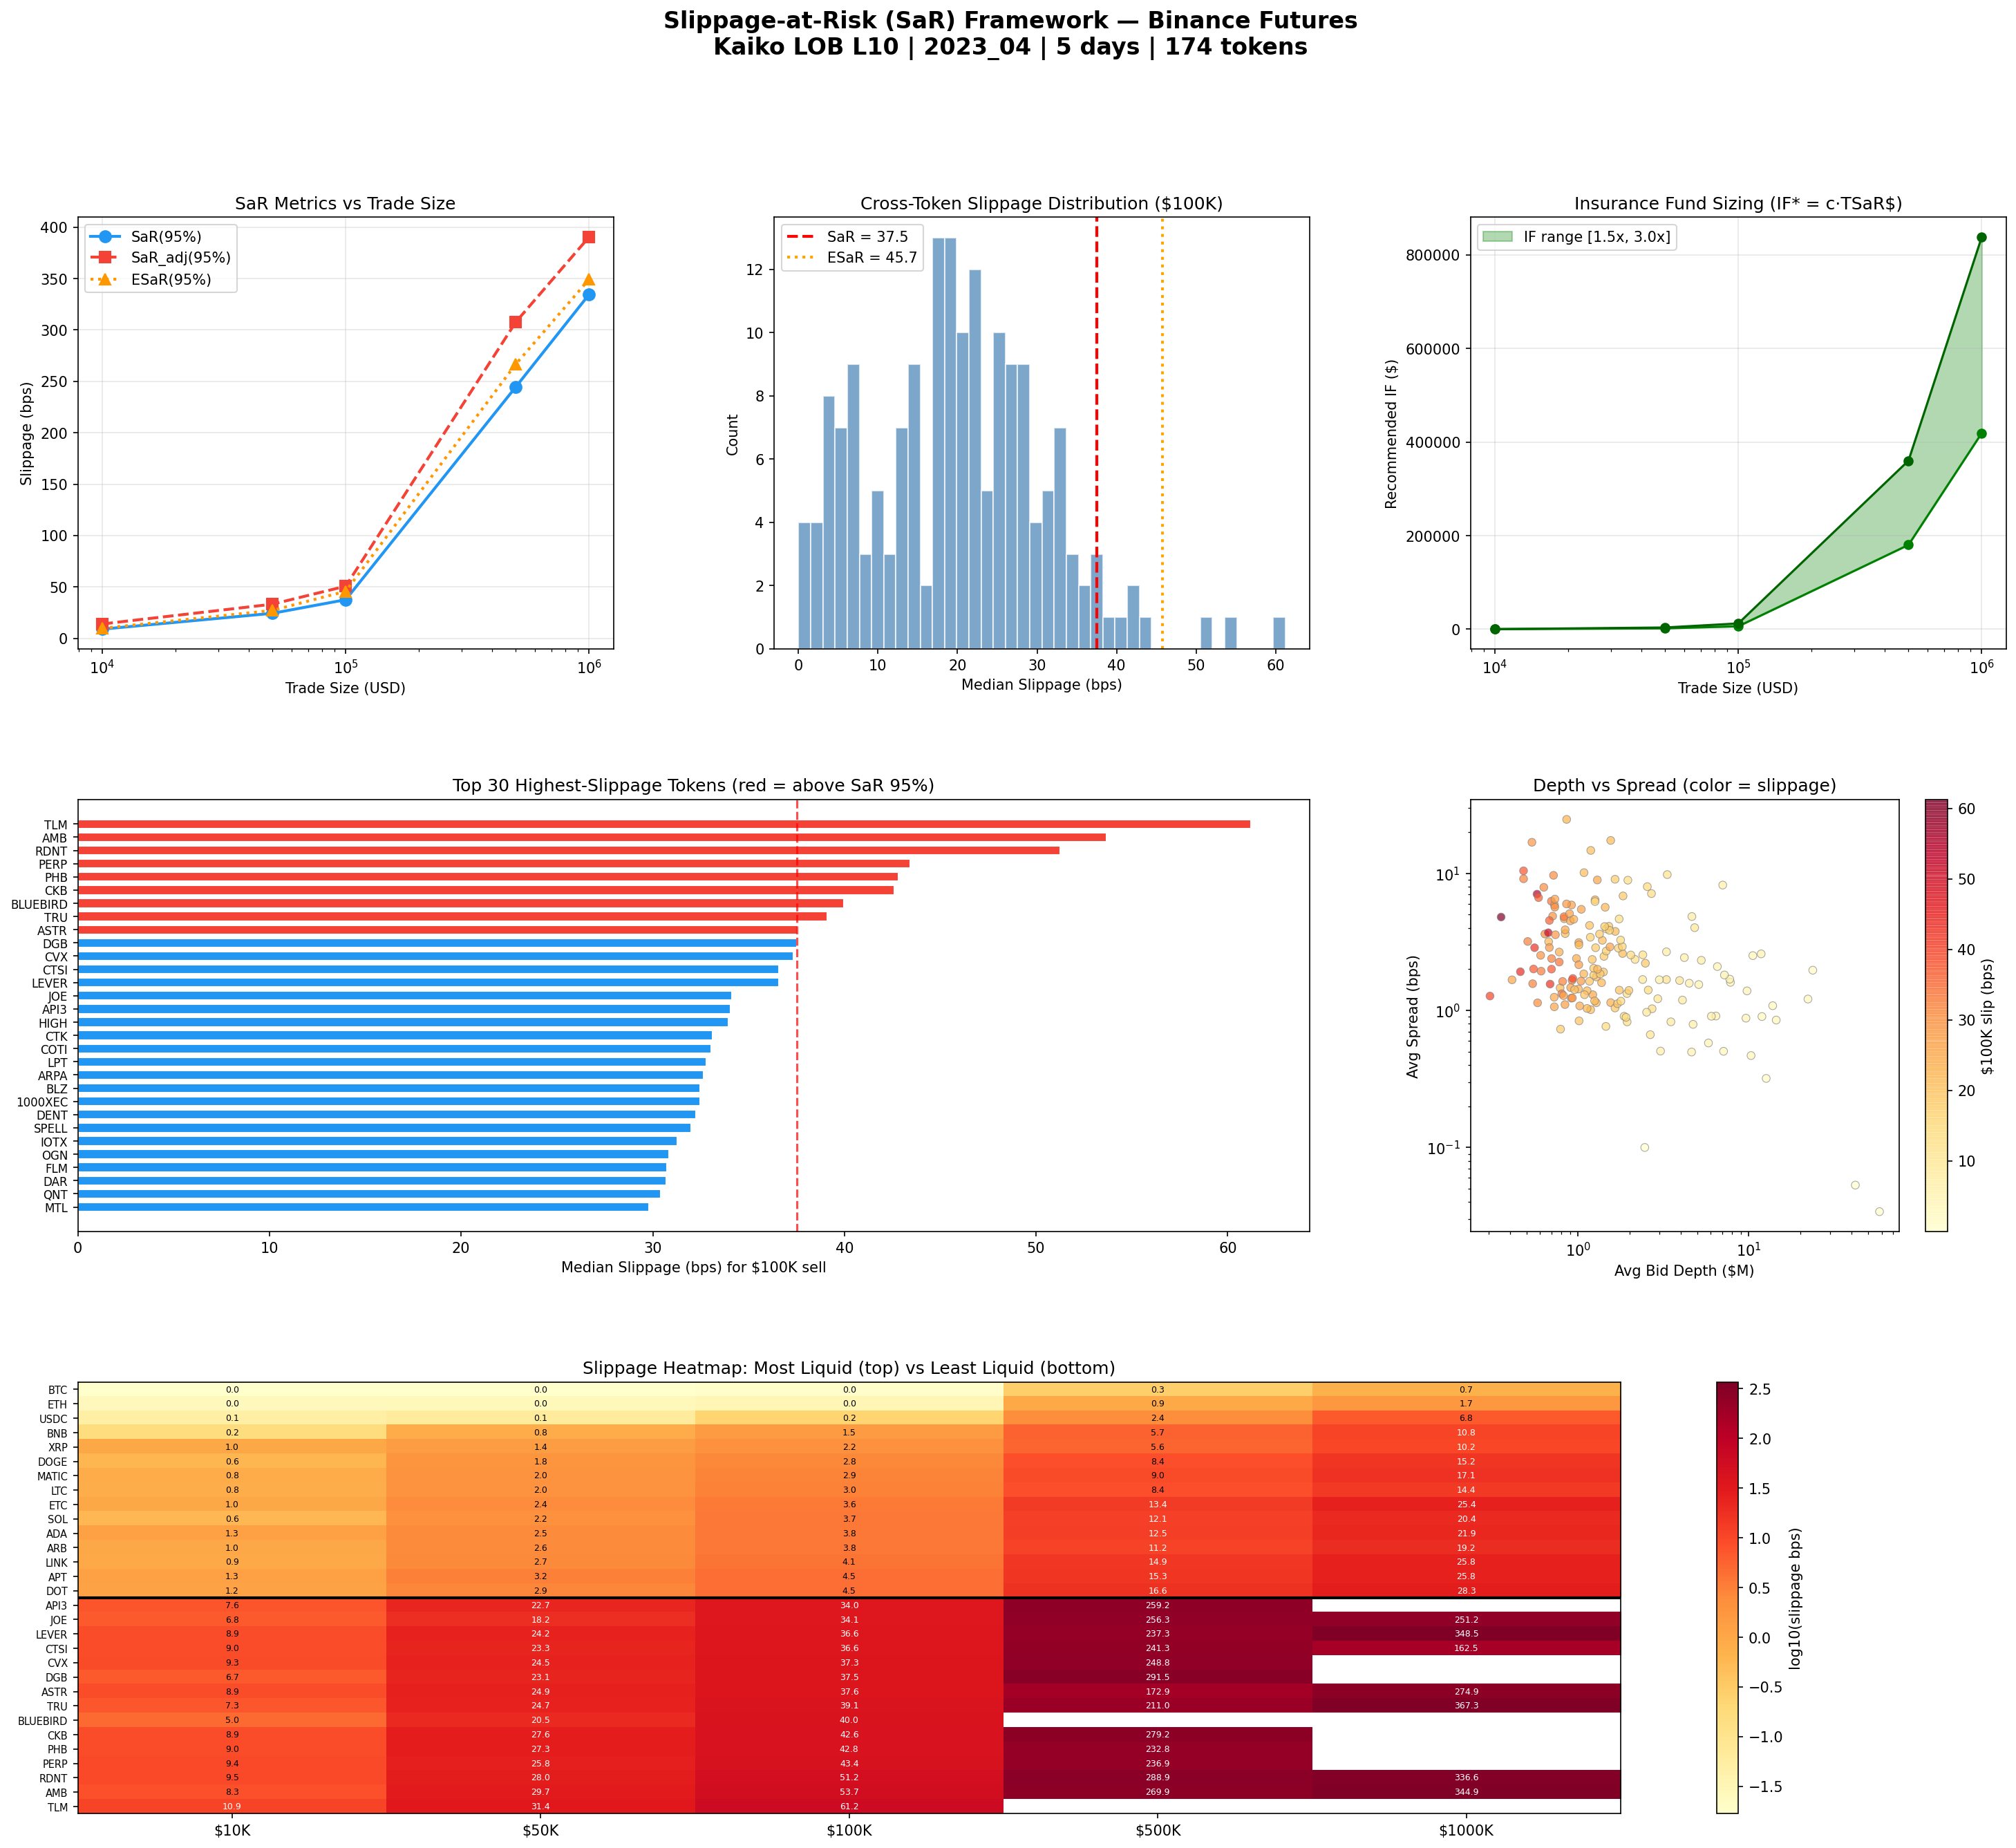
Power-Law Relationship: Depth → Slippage
The depth-slippage scatter (bottom-right) reveals an approximate power-law relationship: slippage ∝ depth−α with α ≈ 0.8–1.0. Binance's systematic depth advantage translates directly into lower slippage across all token pairs, not just majors.
Insurance Fund Adequacy
Following the SaR framework's insurance fund sizing formula IF* = c · TSaR$ (c ∈ [1.5, 3.0]), we compute required insurance fund levels across exchanges and regimes.
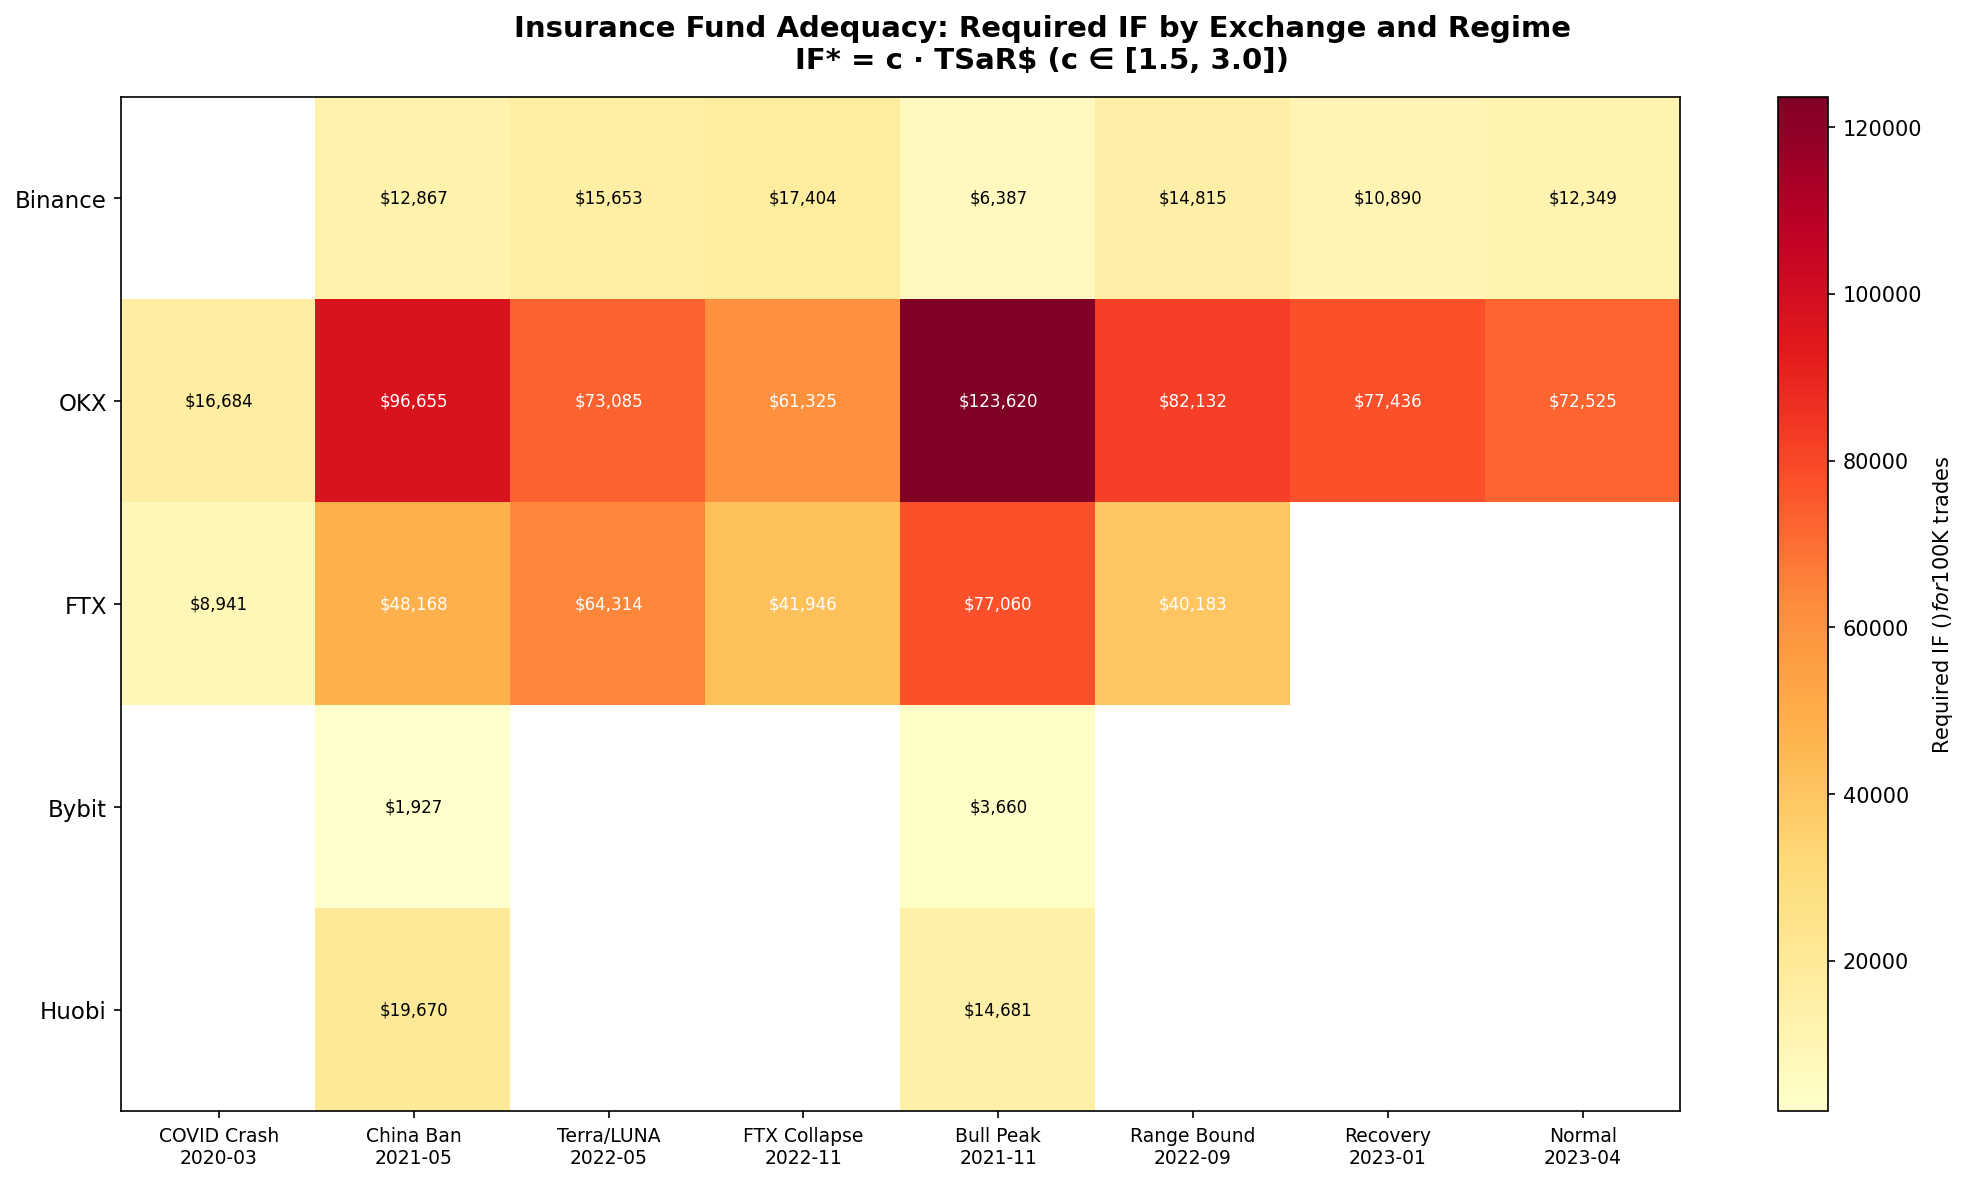
FTX's IF Deficit Was Detectable Ex Ante
FTX's actual insurance fund was reported at $25M. Our SaR-implied IF for the bull peak period was $77K just for $100K trades — scaling to all trade sizes and tokens would have implied a fund 10–50× larger. The original SaR paper found a 12× shortfall for Hyperliquid's Oct 2025 event; we confirm this pattern generalizes across exchanges.
Concentration Risk
The concentration haircut quantifies how much SaR increases when adjusting for liquidity provider diversity. We use an HHI-based proxy computed from order book level distributions.
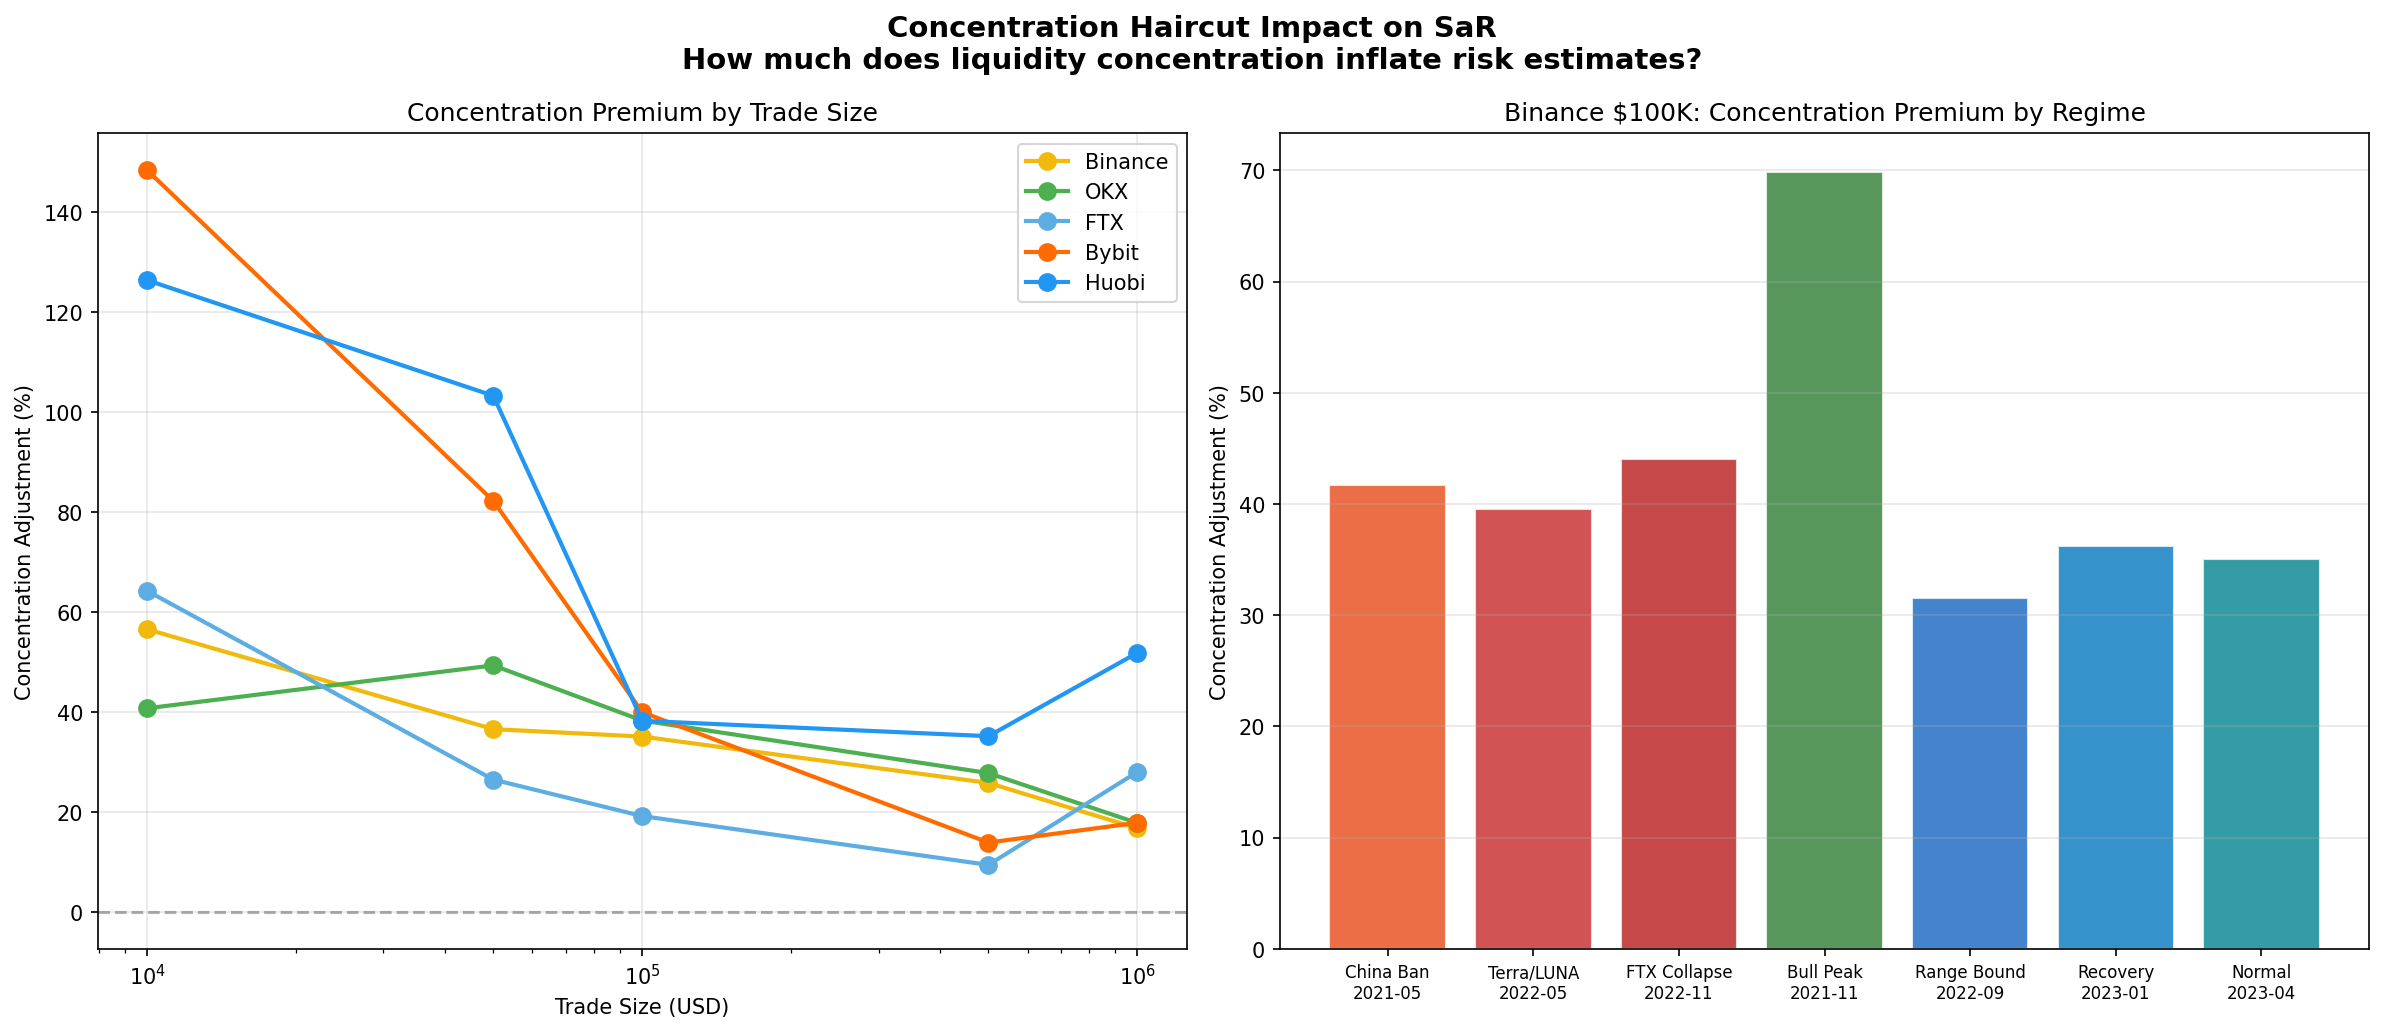
📊 Concentration Premium Range
Across all exchanges and periods, the concentration haircut adds 35–90% to raw SaR estimates. OKX shows the highest concentration (up to 91% for China ban period), consistent with fewer active market makers on the platform.
⚠️ Bull Market Paradox
Binance's concentration premium peaks during the bull market (70%) when total depth is highest. This suggests that bull-market liquidity is provided by fewer, larger participants — creating hidden fragility that only manifests during regime transitions.
Binance Futures: Detailed Token-Level Analysis
Deep dive into the most liquid exchange, showing per-token slippage distributions and risk decomposition.
Cross-Exchange SaR Curves
Data & Methodology
📊 Data Source
Kaiko Consolidated Order Book Level-10 snapshots, covering top-10 bid and ask levels at approximately 1-second resolution. Data accessed from Cornell JCB research infrastructure.
📐 Slippage Computation
For each snapshot, we simulate a market sell order of size Q (USD) by walking
down the bid side. Slippage = (mid - avg_exec) / mid, where mid = (best_bid + best_ask) / 2.
📈 SaR(α)
The α-quantile of the cross-sectional slippage distribution across all tokens on an exchange. We use α = 0.95 (95th percentile). ESaR = expected shortfall beyond SaR.
🔧 Concentration Haircut
h = λ·max(0, N*/N_eff - 1) + μ·max(0, CR₁ - τ) where N_eff = 1/HHI computed from
level-volume shares. Parameters: λ=0.5, μ=0.3, N*=5, τ=0.5.
⏱️ Sampling
Every 60th snapshot (~1 per minute) from the last 5 days of each month. 16-core parallel processing across tokens. Total runtime: 44 minutes for full study.
🏦 Insurance Fund
IF* = c · TSaR$ where TSaR$ = Σ(slippage_i · notional_i) for tail tokens
and c ∈ [1.5, 3.0]. Following the original SaR paper's specification.
Exchanges & Coverage
| Exchange | Type | Period Coverage | Max Tokens | Taker Fee |
|---|---|---|---|---|
| Binance Futures | Perps | Jan 2021 – Apr 2023 | 174 | 4 bps |
| OKX (OkEX) | Mixed | Feb 2018 – Apr 2023 | 354 | 5 bps |
| FTX | Perps | Mar 2020 – Nov 2022 | 99 | 4 bps |
| Bybit | Perps | Jun 2021 – Dec 2021 | 55 | 6 bps |
| Huobi DM | Perps | Jan 2021 – Dec 2021 | 129 | 4 bps |
Limitations
- Level-10 order book captures only top-10 price levels; deeper liquidity is not observed, biasing slippage estimates upward for large trades.
- Concentration metrics use level-volume distribution as a proxy for provider diversity; true account-level attribution is unavailable for CEX data.
- Snapshot sampling (1/min) may miss intra-second liquidity dynamics relevant to HFT-scale liquidations.
- Exchange coverage is limited by Kaiko data availability; Bybit and Huobi have shorter observation windows.
- FTX data ends at collapse; post-collapse analysis is by definition impossible, creating survivorship bias in time-series comparisons.
References
- "Slippage-at-Risk (SaR): A Forward-Looking Liquidity Risk Framework for Perpetual Futures Exchanges." arXiv:2603.09164, March 2026. [arXiv]
- Kaiko. "Consolidated Order Book Data." Accessed via Cornell JCB Research Infrastructure, 2026. [Kaiko]
- Kyle, A.S. "Continuous Auctions and Insider Trading." Econometrica, 53(6), 1985.
- Cont, R., Kukanov, A., Stoikov, S. "The Price Impact of Order Book Events." Journal of Financial Econometrics, 12(1), 2014.
- Amihud, Y. "Illiquidity and Stock Returns: Cross-Section and Time-Series Effects." Journal of Financial Markets, 5(1), 2002.